How to use the Request Processing Analyzer to analyze the recent requests in Adobe Experience Manager(AEM)
The “Recent Requests” is a very useful feature on the OSGi Felix Console to know what going on at each request, how is Sling resolving the resources and the time taken to load the sub resources.
This will help as to debug the resource resolution issues and also to capture the time taken to process the resources.
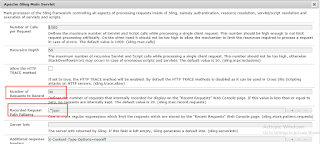
By default 20 recent request are captured in to the recent request console - http://localhost:4502/system/console/requests
The value "Number of Requests to Record" can be changed in the Apache Sling Main Servlet through OSGI console - http://localhost:4502/system/console/configMgr/org.apache.sling.engine.impl.SlingMainServlet
Also the "Recorded Request Path Patterns" can be specified in Apache Sling Main Servlet configuration to only capture the paths that matches the pattern - e.g capture only the json requests.
Unfortunately this will not help us to trace millions of request through console and also only the recent values will be shown based on the configuration.
Sometimes we may need to analyse huge requests during the load testing to identify the time taken by individual request and to identify the requests that taking more time to process.
Sling Request Processing Analyzer help to achieve the above scenario.
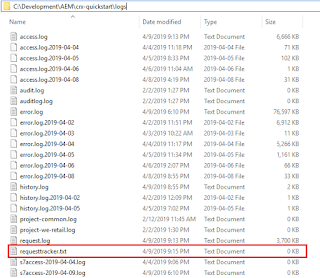
Sling Request Processing Analyzer logs each request in a special file - ${sling.home}/logs/requesttracker.txt with a header line providing core information on the request:
- Start time stamp in ms since the Epoch
- Request processing time in ms
- Request Method
- Request URL
- Response content type (plus character encoding if available)
- Response Status
After that first line the complete data from the requests RequestProgressTracker is dumped.
Configuring Request Processing Analyzer:
- Download the Request Processing Analyzer bundle from https://github.com/apache/sling-org-apache-sling-reqanalyzer
- Build the bundle - mvn clean install
- Install the bundle(org.apache.sling.reqanalyzer-0.0.1-SNAPSHOT.jar) from target folder to server through OSGI console- http://localhost:4502/system/console/bundles
This will create a new log file - requesttracker.txt under ${sling.home}/logs and capture all the request details into the log file.
Analyzing the log file:
The generated log file can be analyzed through the below command.
java -jar C:\sling-org-apache-sling-reqanalyzer-master\target\org.apache.sling.reqanalyzer-0.0.1-SNAPSHOT.jar requesttracker.txt
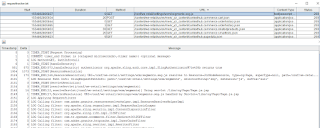
This will open the Swing GUI with basic request details - click on individual request to see more details about the request
The generated log file can be analyzed through system console - http://localhost:4502/system/console/requestanalyzer
Click on Analyze Now action, this will open the same Swing GUI shown above.
Dumping the details to separate log file:
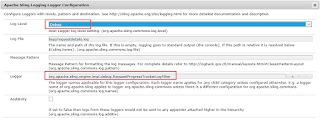
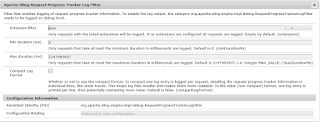
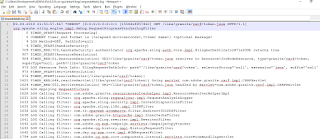
The Request Process details can be dumped to a separate log file for reference through Apache Sling Request Progress Tracker Log Filter - no bundle is required to be installed but this file can't be analyzed through the approach explained above. The dumped file details can be used for manual analysis.
Define a new logger with below details.
Configure Apache Sling Request Progress Tracker Log Filter
Configure the Extension filter with required file extensions for those the request details should be captured.
Select "Compact Log Format" - this will print the logs fin more readable format.


